Note
Go to the end to download the full example code.
Tile maps
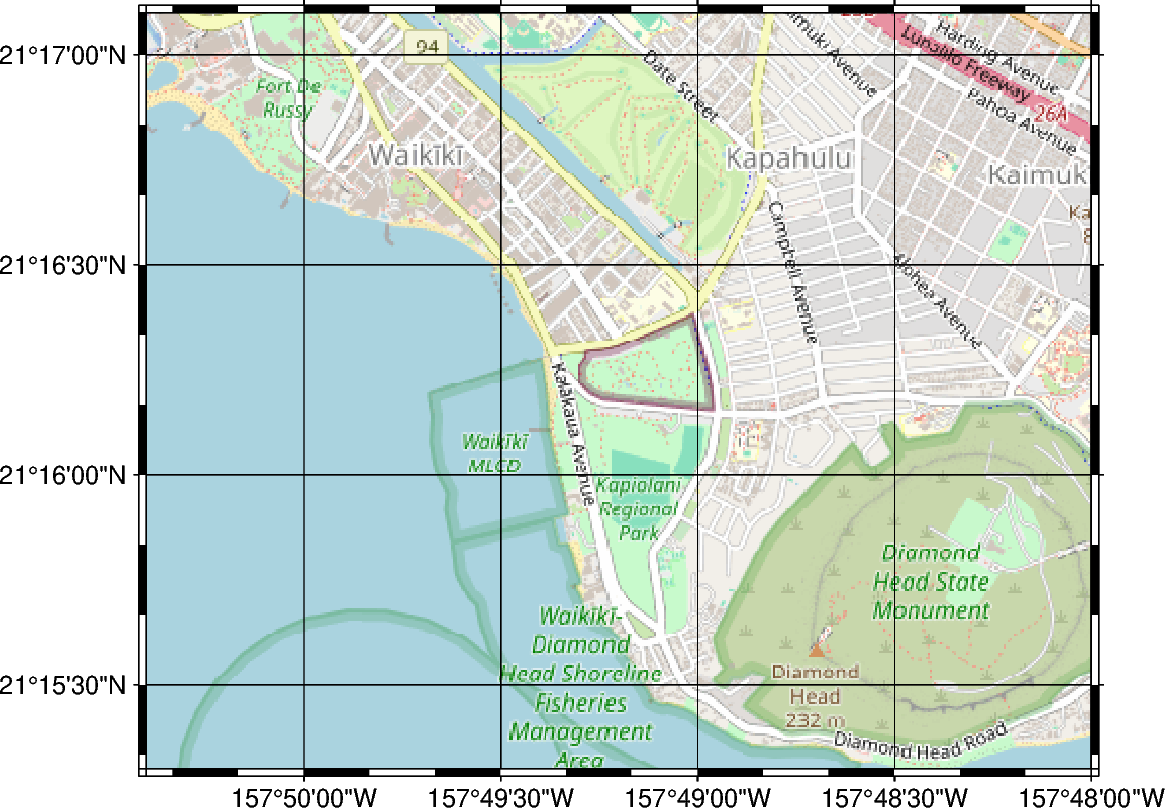
The pygmt.Figure.tilemap method allows to plot tiles from a tile server or
local file as a basemap or overlay.
import contextily
import pygmt
from pygmt.params import Axis

fig = pygmt.Figure()
fig.tilemap(
    region=[-157.84, -157.8, 21.255, 21.285],
    projection="M12c",
    # Set level of details (0-22).
    # Higher levels mean a zoom level closer to the Earth's surface with more tiles
    # covering a smaller geographic area and thus more details and vice versa.
    # Please note, not all zoom levels are always available.
    zoom=14,
    # Use tiles from OpenStreetMap tile server
    source="https://tile.openstreetmap.org/{z}/{x}/{y}.png",
    frame=Axis(annot=True, tick=True, grid=True),
)

fig.show()
It’s also possible to use tiles provided via the contextily library. See Contextily providers for a list of possible tilemap options.
fig = pygmt.Figure()
fig.tilemap(
    region=[-157.84, -157.8, 21.255, 21.285],
    projection="M12c",
    # Use the CartoDB Positron option from contextily
    source=contextily.providers.CartoDB.Positron,
    frame=Axis(annot=True, tick=True, grid=True),
)

fig.show()
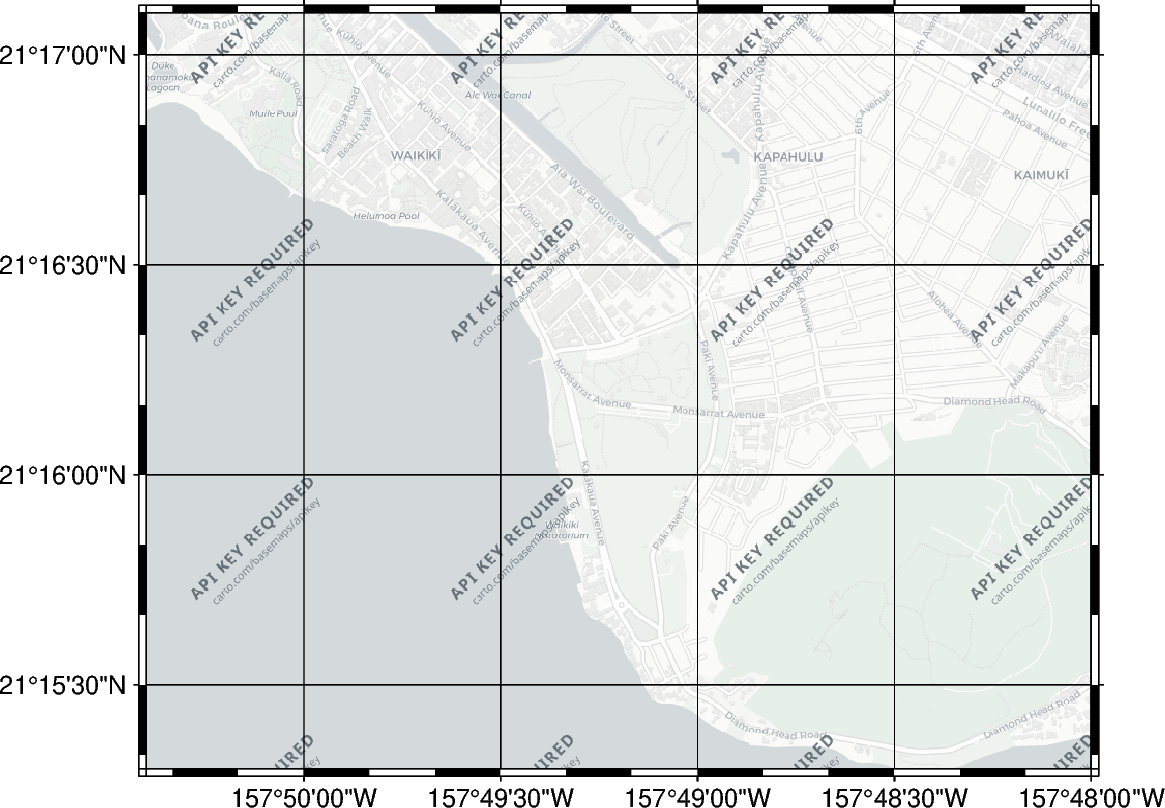
/home/docs/checkouts/readthedocs.org/user_builds/pygmt-dev/conda/4881/lib/python3.14/site-packages/contextily/tile.py:298: UserWarning: CartoDB tiles now require an API key. Please provide one to continue using the tiles. You can request the key at https://carto.com/basemaps/apikey/.
  tile_urls = [provider.build_url(x=tile.x, y=tile.y, z=tile.z) for tile in tiles]
Total running time of the script: (0 minutes 1.649 seconds)